For the complete documentation index, see llms.txt. Markdown versions of all docs pages are available by appending .md to any docs URL.
View and customize access logs
Verified Code examples on this page have been automatically tested and verified.Configure per-request structured access logs with CEL-based filtering and field enrichment.
About access logging
Access logs, sometimes referred to as audit logs, represent all traffic requests that pass through the gateway proxy. The access log entries can be customized to include data from the request, the routing destination, and the response.
Data that can be logged
Access log content is controlled by CEL (Common Expression Language) expressions. You can filter which requests are logged and define custom attributes from the request and response.
For logging, CEL exposes these variable groups when enabled or applicable:
- request: method, URI, host, path, headers, body, and timing
- response: status code, headers, and body
- source: client address, port, and TLS identity
- backend: backend name, type, and protocol
- Auth and metadata:
jwt,apiKey, orbasicAuth, plusextauthzandextprocmetadata - LLM: model, provider, token counts, and optional prompt/completion
- MCP: tool, prompt, and resource name and target
- Guardrails:
guardrails, with entries for prompt-guard evaluations naming the phase, the guard, and the action, includingallow - MCP guardrails:
mcpGuardrails, with dynamic metadata that an ExtMCP request-phase processor returns
Use the filter field in the AgentgatewayPolicy to filter which requests are logged by path, response code, or any other request attribute. Use the attributes list to add or remove log fields by using CEL expressions. For the full variable table, available functions, and examples, see the CEL expressions reference.
Before you begin
- Set up an agentgateway proxy.
- Install the httpbin sample app.
- Set up the OTel stack to export logs to an OTel collector and forward them to Loki.
Enable access logs
Access logs are written to stdout automatically for every request that passes through the gateway proxy. No policy configuration is required to enable them.
Send a request to the httpbin app on the
www.example.comdomain.curl -i http://$INGRESS_GW_ADDRESS:80/get -H "host: www.example.com"Check the gateway logs to see the access log entry for the request.
kubectl -n agentgateway-system logs deployments/agentgateway-proxy | tail -1Example output:
info	request gateway=agentgateway-system/agentgateway-proxy
listener=http route=httpbin/httpbin endpoint=10.244.0.4:8080
src.addr=127.0.0.1:46886 http.method=GET http.host=www.example.com
http.path=/get http.version=HTTP/1.1 http.status=200
protocol=http duration=0ms
To filter which requests are logged or customize log fields, see Filter access logs and Add and remove log fields. To export access logs to an external backend over OTLP, see Export logs over OTLP.
Use OpenTelemetry field names
By default, the stdout access log uses short, human-oriented field names, such as http.path. To rename the built-in HTTP fields to their OpenTelemetry semantic convention equivalents, such as url.path, set preset: Otel in the access log policy.
Use this preset when you ship stdout logs to a pipeline that already expects semantic convention attribute names, so that you do not have to rename the fields downstream.
Create an AgentgatewayPolicy resource that sets the preset.
kubectl apply -f- <<EOF
apiVersion: agentgateway.dev/v1alpha1
kind: AgentgatewayPolicy
metadata:
  name: access-logs-otel
  namespace: agentgateway-system
spec:
  targetRefs:
  - group: gateway.networking.k8s.io
    kind: Gateway
    name: agentgateway-proxy
  frontend:
    accessLog:
      preset: Otel
EOF
Send a request that includes a query string, such as
/get?foo=bar, and check the gateway logs. The built-in HTTP fields now use semantic convention names.info request gateway=agentgateway-system/agentgateway-proxy listener=http route=httpbin/httpbin endpoint=10.244.0.7:8080 client.address=127.0.0.1 http.request.method=GET server.address=www.example.com url.path=/get network.protocol.version=1.1 http.response.status_code=200 protocol=http duration=0ms url.scheme=http url.query=foo=bar
The preset renames the following built-in fields.
| Default field | Field with preset: Otel |
|---|---|
src.addr | client.address. The value is the client IP address without the port. |
http.method | http.request.method |
http.host | server.address |
http.path | url.path. The value is the path only. Any query string moves to a separate url.query field instead of staying on the path. |
http.version | network.protocol.version. The value is the bare version, such as 1.1 instead of HTTP/1.1. |
http.status | http.response.status_code |
The preset also adds url.scheme, and it adds server.port and url.query when the request supplies them. These added fields are appended to the end of the log line, after duration, rather than placed next to the other HTTP fields.
Fields that you add yourself with the attributes field are not renamed, so choose semantic convention names for them if you want the whole line to be consistent. Fields that are not part of the HTTP field set, such as gateway, route, and duration, keep their names.
Note
The preset changes only the stdout access log, and only for HTTP traffic. A TCP listener has no HTTP field set to rename, so the preset has no effect there. An OTLP export already uses semantic convention attribute names, so it is unaffected. For more information, see Export logs over OTLP.
Log the selected backend endpoint
Use backend.endpoint in an access log expression to record the resolved destination of a directly addressed backend, such as a static hostname, including its port for a network endpoint. backend.name identifies the configured backend; backend.endpoint identifies the selected call target. The endpoint is available only after target resolution. Service backends leave backend.endpoint unset because their workload endpoints are selected separately.
Add an attribute to the frontend.accessLog.attributes.add list in your policy. Guard the lookup for Service backends and requests rejected before a backend is resolved.
frontend:
  accessLog:
    attributes:
      add:
      - name: backend_endpoint
        expression: 'has(backend.endpoint) ? backend.endpoint : ""'
Filter access logs
Use a CEL expression to log only a subset of requests. Requests that do not match the expression are not logged.
Create an AgentgatewayPolicy resource with a
filterexpression. The following example produces access logs only for requests with a response code of 400 or greater.1 2 3 4 5 6 7 8 9 10 11 12 13 14 15kubectl apply -f- <<EOF apiVersion: agentgateway.dev/v1alpha1 kind: AgentgatewayPolicy metadata: name: access-logs namespace: agentgateway-system spec: targetRefs: - group: gateway.networking.k8s.io kind: Gateway name: agentgateway-proxy frontend: accessLog: filter: 'response.code >= 400' EOFSend a request that returns a 400 response code.
curl -i http://$INGRESS_GW_ADDRESS:80/status/400 -H "host: www.example.com"Check the gateway logs and verify that an access log entry was written for the 400 request.
kubectl -n agentgateway-system logs deployments/agentgateway-proxy | tail -1Example output:
info	request gateway=agentgateway-system/agentgateway-proxy
listener=http route=httpbin/httpbin endpoint=10.244.0.4:8080
src.addr=127.0.0.1:46886 http.method=GET http.host=www.example.com
http.path=/status/400 http.version=HTTP/1.1 http.status=400
protocol=http duration=0ms
Send a successful request.
curl -i http://$INGRESS_GW_ADDRESS:80/get -H "host: www.example.com"Check the logs again and verify that no new entry appears. Because the response code was
200, the filter expressionresponse.code >= 400does not match and no log is written.kubectl -n agentgateway-system logs deployments/agentgateway-proxy | tail -1Example output (the last entry is still the 400 request from step 2):
info	request gateway=agentgateway-system/agentgateway-proxy
listener=http route=httpbin/httpbin endpoint=10.244.0.4:8080
src.addr=127.0.0.1:46886 http.method=GET http.host=www.example.com
http.path=/status/400 http.version=HTTP/1.1 http.status=400
protocol=http duration=0ms
Add and remove log fields
You can add custom fields to every access log line by using CEL expressions that are evaluated against the request and response context. You can also remove default fields that you do not need.
Create an AgentgatewayPolicy resource that adds custom attributes and removes a default field. The following example adds 3 fields to every access log entry:
user_id: Extracts the value of thex-user-idrequest header.env: Adds a static string ofproduction.
The example also removes the
http.hostdefault field.1 2 3 4 5 6 7 8 9 10 11 12 13 14 15 16 17 18 19 20 21 22kubectl apply -f- <<EOF apiVersion: agentgateway.dev/v1alpha1 kind: AgentgatewayPolicy metadata: name: access-logs namespace: agentgateway-system spec: targetRefs: - group: gateway.networking.k8s.io kind: Gateway name: agentgateway-proxy frontend: accessLog: attributes: add: - name: user_id expression: 'request.headers["x-user-id"]' - name: env expression: '"production"' remove: - http.host EOFSend a request with an
x-user-idheader.curl -i http://$INGRESS_GW_ADDRESS:80/get -H "host: www.example.com" -H "x-user-id: user-123"Check the gateway logs and verify you can see the custom fields in your log entry, and that the
http.hostfield is absent.kubectl -n agentgateway-system logs deployments/agentgateway-proxy | tail -1Example output:
info	request gateway=agentgateway-system/agentgateway-proxy
listener=http route=httpbin/httpbin endpoint=10.244.0.4:8080
src.addr=127.0.0.1:46886 http.method=GET http.path=/get
http.version=HTTP/1.1 http.status=200 protocol=http duration=0ms
user_id="user-123" env="production"
Log guardrail results
Prompt guards record their evaluation results in the request’s dynamic metadata, under the guardrails variable. Results include allow when a guard accepts the content, as well as actions that mask, reject, audit, or fail open. Add the variable to an access log field to record which guards ran and their outcomes.
The variable holds entries for guardrail evaluations in either the request or the response phase. A nonempty list does not necessarily mean that a guardrail intervened: every entry might have the action allow.
If a request guard rejects an LLM request before the provider call, the access log still receives request-side LLM metadata and the guardrails entry. Provider response fields are absent because the request never reaches the LLM provider.
The following table describes the properties of each result in the guardrails list. Agentgateway populates these values when a guard runs; they are not configuration fields. The [] notation means “each entry in the list” and is not literal CEL syntax. For example, guardrails[0].action reads the first result’s action.
| Result property | Description |
|---|---|
guardrails[].phase | The phase that the guardrail evaluated, either request or response. |
guardrails[].guard | The guard kind that was evaluated, such as regex, webhook, openAIModeration, bedrockGuardrails, googleModelArmor, or azureContentSafety. |
guardrails[].action | The action that the guardrail took, one of allow, mask, reject, audit, or failOpen. |
guardrails[].guardrailId | The configured guardrail identifier. |
guardrails[].guardrailVersion | The configured guardrail version. |
guardrails[].actionReason | The reason that the guardrail reported for its action. |
guardrails[].assessments | The assessment detail that the guardrail provider reported, redacted to metadata only. Content-bearing fields, such as the matched text, are never included. |
Note
Only CEL that runs after the request completes, such as an access log field or a metric field, receives the guardrails variable. An authorization or transformation expression that runs mid-request never sees it.
Set spec.frontend.accessLog.filter to a CEL expression that returns true for requests you want to log. The size() function counts list entries, and the exists macro checks whether any entry matches a condition. They are CEL operations on the list, rather than result properties from the table.
Value of spec.frontend.accessLog.filter | Requests logged |
|---|---|
guardrails.size() > 0 | Requests with at least one guardrail result, including requests that every guard allows. |
guardrails.exists(g, g.action != "allow") | Requests with at least one result whose action is not allow. The variable g represents each result as the condition is checked. |
To choose what is recorded in a log field, set spec.frontend.accessLog.attributes.add[].expression. The following AgentgatewayPolicy uses guardrails to record the whole list and guardrails.size() > 0 to select requests with results. To record just the first result’s action, use guardrails[0].action as the attribute expression with the same nonempty-list filter.
kubectl apply -f- <<EOF
apiVersion: agentgateway.dev/v1alpha1
kind: AgentgatewayPolicy
metadata:
  name: guardrail-access-logs
  namespace: agentgateway-system
spec:
  targetRefs:
  - group: gateway.networking.k8s.io
    kind: Gateway
    name: agentgateway-proxy
  frontend:
    accessLog:
      filter: guardrails.size() > 0
      attributes:
        add:
        - name: guardrails
          expression: guardrails
EOF
Access logging is a frontend policy, so it attaches to a Gateway rather than to the LLM backend that the prompt guard attaches to. To set up a guard that produces these entries, see the guardrails docs.
View access logs in Loki
If you set up the OTel stack, the opentelemetry-collector-logs deployment is ready to receive access logs via OTLPs. Configure the agentgateway proxy to send access logs to it, then query them in Grafana through Loki.
Create a AgentgatewayPolicy resource that points the agentgateway proxy at the OTel collector.
kubectl apply -f- <<EOF
apiVersion: agentgateway.dev/v1alpha1
kind: AgentgatewayPolicy
metadata:
  name: access-logs
  namespace: agentgateway-system
spec:
  targetRefs:
  - group: gateway.networking.k8s.io
    kind: Gateway
    name: agentgateway-proxy
  frontend:
    accessLog:
      otlp:
        backendRef:
          name: opentelemetry-collector-logs
          namespace: telemetry
          port: 4317
        protocol: GRPC
EOF
Tip
To filter which logs are exported, add custom fields, or send logs to a different backend, see Export logs over OTLP.
Open Grafana.
Port-forward the Grafana service.
kubectl port-forward svc/kube-prometheus-stack-grafana -n telemetry 3000:80Open Grafana at http://localhost:3000.
Log in to Grafana with the
adminusernameprom-operatorpassword .
Go to Explore and select Loki as the data source.
Use the Label browser to find your log stream, then add filters to narrow results. Each proxied request is stored as a log entry with structured metadata attributes such as
http.method,http.path, andhttp.status. Use the following filter patterns:Goal LogQL filter Requests to a specific path | http_path="/get"Error responses (4xx/5xx) | http_status="400"or| http_status="500"Logs from a specific gateway | gateway="agentgateway-system/agentgateway-proxy"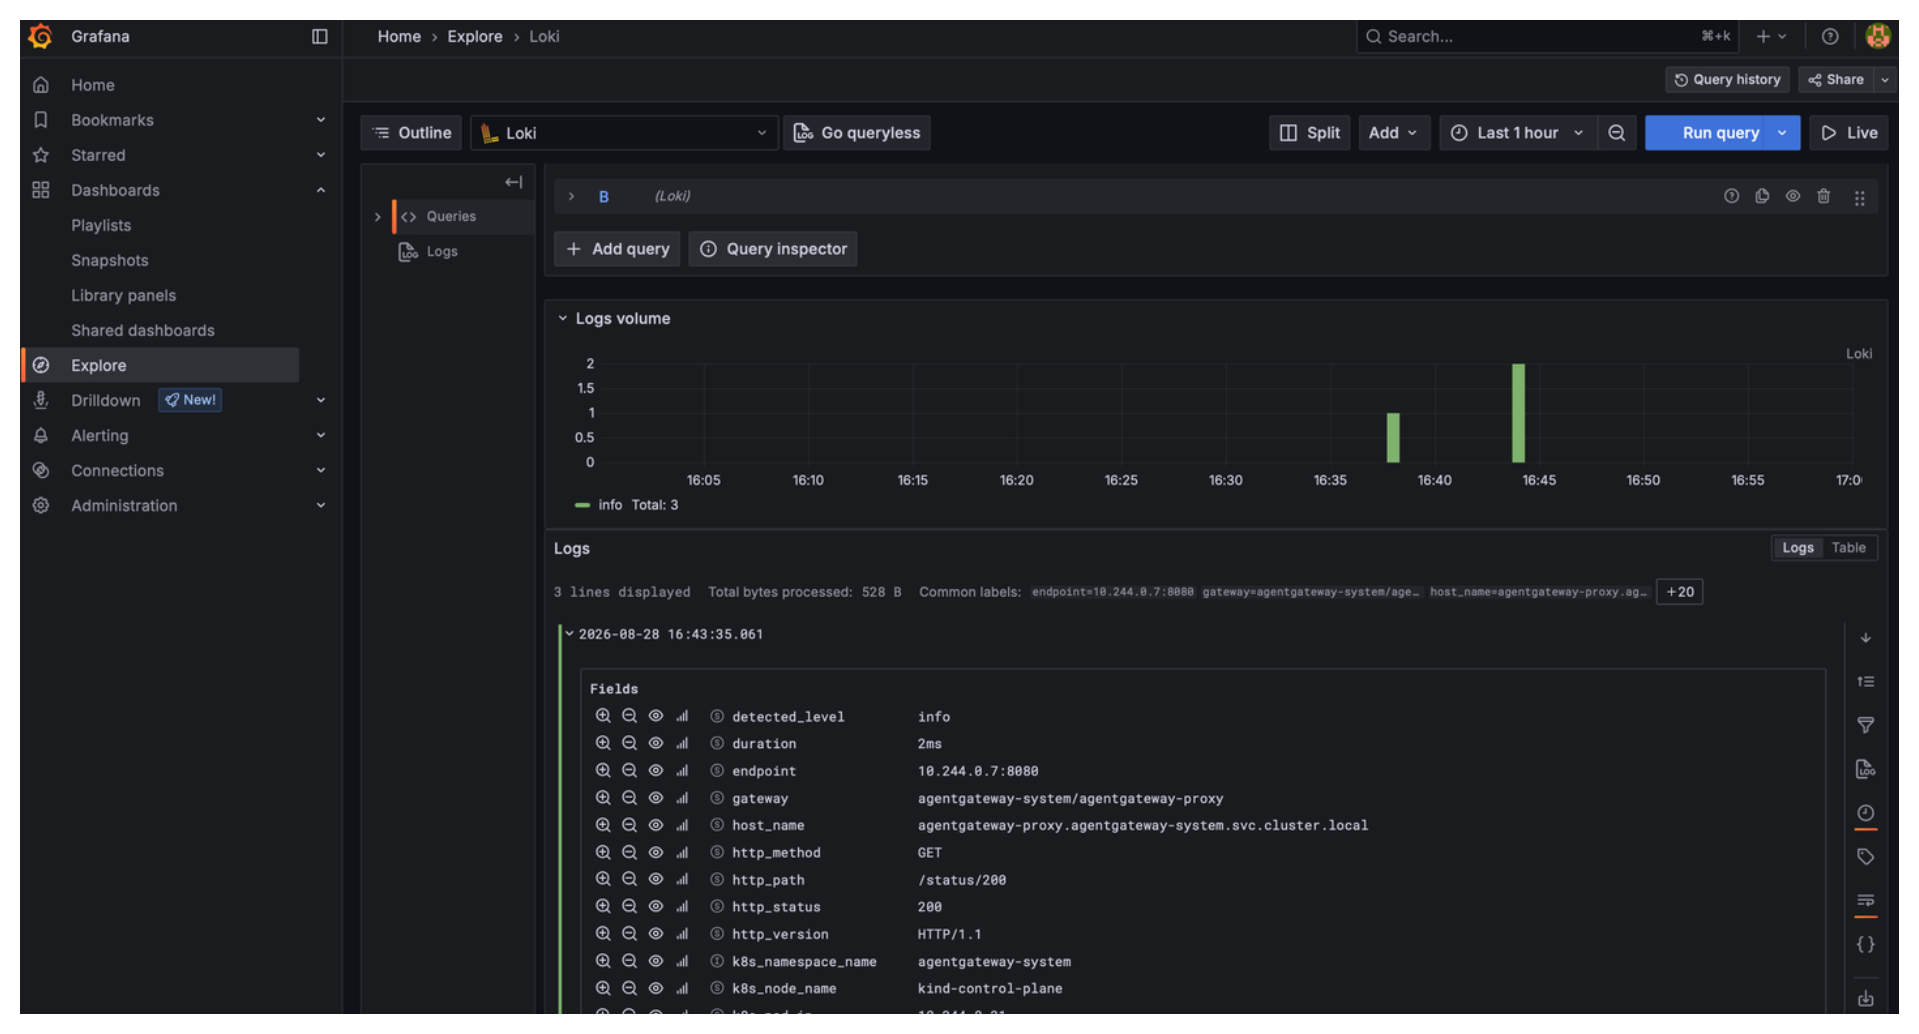
Log MCP guardrail metadata
An ExtMCP request-phase guardrail can return dynamic metadata with a Pass or mutated result. After the MCP request completes, access-log CEL can read that metadata from the mcpGuardrails variable. Access-log CEL can also read the metadata for requests that resume a stateful MCP session. Use mcpGuardrails to record policy-server decisions that are not part of the default MCP log fields.
The metadata keys depend on the ExtMCP server response. The following example records the decision key when the policy server returns metadata such as {"decision":"allow"}.
frontend:
  accessLog:
    attributes:
      add:
      - name: mcp_guardrail_decision
        expression: 'mcpGuardrails != null ? string(mcpGuardrails.decision) : ""'
Cleanup
You can remove the resources that you created in this guide. Run the following command.
kubectl delete AgentgatewayPolicy access-logs -n agentgateway-system